Android build rendering options for performance

Hi!

I’m developing a 3d game for mobile with creator 3.0. I’m having a hard time understanding what configuration related to rendering is available and needed to consider when building a game for android.

The scenario here to illustrate the problem is a game with a simple scene filled with 100 boxes using default box mesh and materials. The scene does not have dynamic lights.

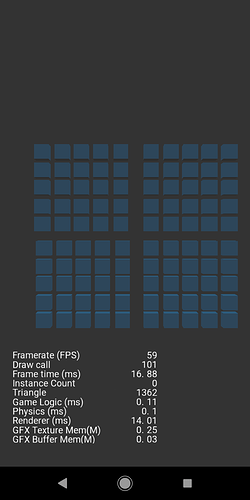
The issue I’m having is that in preview or mobile web build the rendering time based on the debug info is about half than in android build. If batching is used the overall performance gets better as expected but the difference between the builds grows.

Is there any material available or any tips that could help understand where this kind of difference in performance could be coming from?

Test project if needed: GitHub - migguli/cocos-boxtest
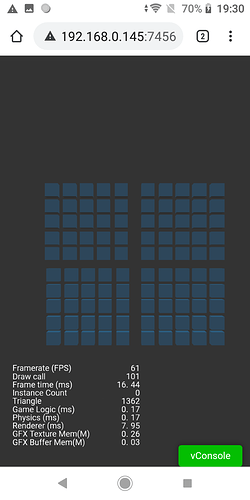
I think this might have something to do with the resolution the game is trying to render in mobile?

Hello, can you show us the configuration of your scene, the materials used?

Sure thing. Thanks for asking.

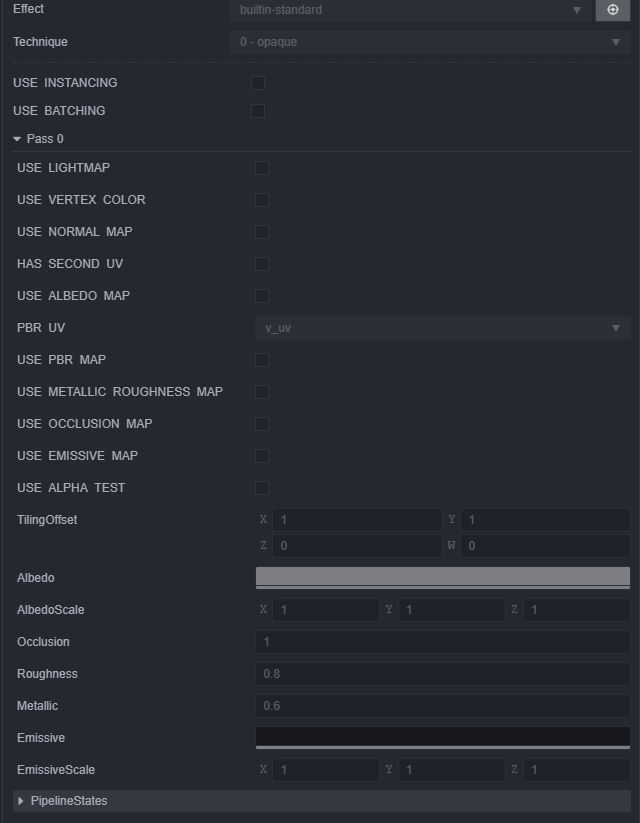
To test this I used the default-material.mtl that comes with creator. Screenshot below.

image

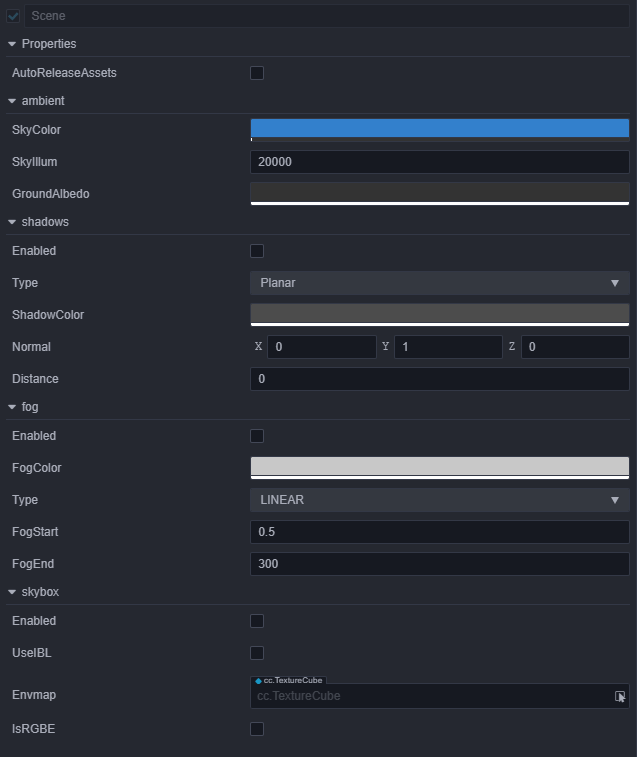
The scene is also just at it’s basic settings.

image

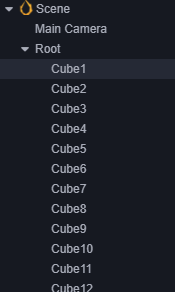
Scene tree below. just cubes till the end.

image

https://184.169.198.12/t/understanding-camera-screenscale/52963/2?u=migguli

I’m not sure I get you correctly, you mean the android native build cost more time in renderer than the web build ? If that’s the case, then the main reason could be related to the renderer logic which is different in native and web. The core difference is that currently part of the renderer is implemented in TS and part in C++, that requires data sharing, transforming, and binding APIs. Need to claim some facts here, TS in itself with JIT is very fast, C++ is very fast, but the communication between the two could be costy. I haven’t investigate in the case you are showing, I believe it’s mostly due to the data collection for all the boxes, and the difference between the two platform shouldn’t be larger while the number of boxes go up.

We do have a solid plan on native platform. Basically, more stuff will go into C++, and we will control the communication cost between the two languages. We are putting a lot of effort before the release of 3.0, till now, and will go on in very long while to improve the native performance.

Besides, for improve rendering performance for such use case (multiple objects sharing the same material), you can batch them by checking USE INSTANCING in the material. It’s a very low cost batch solution, should improve on all platforms and narrow the performance difference

Thanks for the performance improvements tips. And good to know what you are planning to implement next.

The problem is indeed that when building the same project for mobile web and android, running on the same device, there is a big difference in rendering time. Using instancing, smaller meshes or textures does improve rendering speed significantly like you said. The relative difference between the 2 builds stays about the same, about 2-3 times higher time in native.

Tested with xperia L3 and galaxy s10. Galaxy performs much better as expected, but a relative difference is about the same.

Thanks for the info

As the picture posted above, web and android is more or less the same. One is 61 FPS, another is 59 FPS. And did you use release mode in native android?

The big difference in the above pictures is in the time needed for rendering.

Those images are from a simple test project to illustrate the relative rendering time difference. In an actual game, the time needed for rendering quickly makes a framerate drop quite low in native builds while still staying above 60fps in the browser.

I can expand the test case to be closer to an actual game scene and include textures, instancing, and custom meshes and make it heavy enough to drop the fps in native. Would that help?

Using a release build in android studio and cocos creator for native android does not differ from a debug build.

I actually haven’t tested yet if this happens with iOS as well. I’ll give it a try and report here.

Tested with iphone 8. About 1.5 times higher rendering time in native iOS than in web preview.

Got it, i will check it. What backend did you use? GLES2, GLES3 or vulkan?

I ran the sample. Yep, the native is slower than web on my iPhone 11. The reason are:

  • rendering time is the time of Root.frameMove()
// Director.mainLoop()
this.emit(Director.EVENT_BEFORE_DRAW);
this._root!.frameMove(this._deltaTime);
this.emit(Director.EVENT_AFTER_DRAW);
// Root.frameMove()

public frameMove(deltaTime: number) {
    for (let i = 0; i < scenes.length; i++) {
        scenes[i].update(stamp);
    }
    ...
    this._pipeline.render(cameraList);
    this._device.present();
}

Only this._pipeline.render() and this._device.present are implemented in native, other codes are implemented in TS. As want to share memory between TS and c++, engine uses memory pool to record class members, some datas are recored twice, for example,

// Model.ts
public createBoundingShape (minPos?: Vec3, maxPos?: Vec3) {
        if (!minPos || !maxPos) { return; }
        this._modelBounds = AABB.fromPoints(AABB.create(), minPos, maxPos);
        this._worldBounds = AABB.clone(this._modelBounds);
        if (this._hWorldBounds === NULL_HANDLE) {
            this._hWorldBounds = AABBPool.alloc();
            ModelPool.set(this._handle, ModelView.WORLD_BOUNDS, this._hWorldBounds);
        }
        AABBPool.setVec3(this._hWorldBounds, AABBView.CENTER, this._worldBounds.center);
        AABBPool.setVec3(this._hWorldBounds, AABBView.HALF_EXTENSION, this._worldBounds.halfExtents);
    }

ModelPool and AABBPool are TypedArrays created by c++. Set/get data in TypedArray is slow.

If i only record the time of this._pipeline.render() and this._device.present(), then native is faster than web. So we should do more optimization in future.

Hmm, interesting. Thanks for the detailed root cause analysis. Hopefully, you’ll find good solutions to improve the engine.

I tested with all 3 renderer backends for android. Similar results.

I’m guessing that many of those shared buffer updates use some kind of flags to determine whether to update or not in a frame? In that case, one possible way to speed up in native could be to pay extra attention when updating node transformation, especially for mesh renderers?

Any other ideas to work around this bottleneck would be welcome also.

It happens only data are modified. But as data are stored in TypedArray, then the get speed is affected too.