A radar chart (also known as a network chart, star chart, or spider web chart) is a graphical method of displaying multivariable data in the form of a two-dimensional chart of three or more quantitative variables on the axis starting from the same point.
A radar chart can be used for statistics or comparisons. It is handy to see which variables have similar values and whether there are outliers between variables.
For example, it is used in the music selection menu in Dance Dance Revolution games:

In this article, Pippi from Rookie Little Stack (a group that shares tutorials on Cocos Creator and how to build shaders) will share how to draw cool radar charts in Cocos Creator. The original code was reduced to a certain extent, to ensure a great reading experience. Those who need the complete code file can get it here.
What should we expect after reading this tutorial?
A final product, such as:
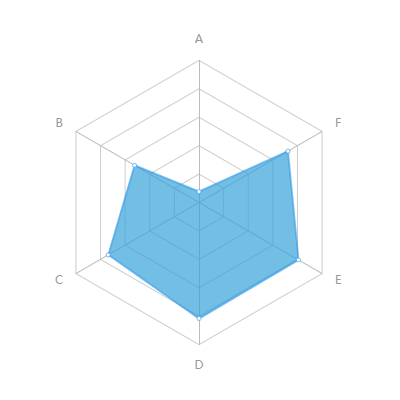
Simple
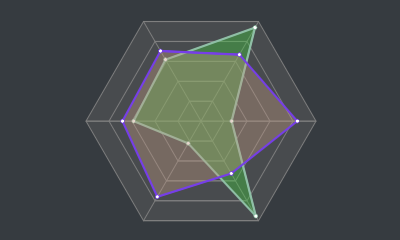
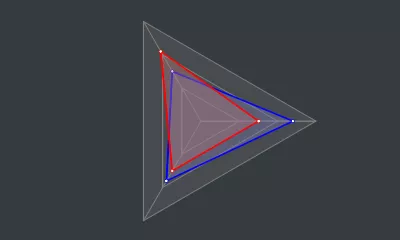
Complex
Before formally starting to make radar charts, it is necessary to have a general understanding of the graphics component in the Cocos Creator engine.
The graphics component inherits from the cc.RenderComponent. With this component, we can implement functions such as drawing lines and filling in polygrams.
Properties
Here are the attributes that will use this time:
- lineCap: Set or return the style of both ends of the line (none, round cap or square cap)
- lineJoin: Set or return the corner style when two lines intersect (bevel, rounded or sharp)
- lineWidth: Set or return the thickness of the current brush (the width of the line)
- strokeColor: Set or return the color of the current pen
- fillColor: Set or return the color used for filling (paint bucket)
Functions
Here are the functions that will use this time:
- moveTo(x, y): Lift the pen and move it to the specified position (do not create a line)
- lineTo(x, y): Put down the brush and create a straight line to the specified position
- circle(cx, cy, r): Draw a circle at the specified position (cx, cy is the center of the circle)
- close(): Close the created line (equivalent to lineTo(x,y))
- stroke(): Draw a line that has been created (but not drawn) (think of the line as transparent by default, this behavior is to give the line color)
- fill(): Fill the area enclosed by the current line (if the line is not closed, it will try to “simulate closed” start and endpoints)
- clear(): Wipe everything on the current drawing board
For more information, please refer to the Graphics Component documentation.
Properties of a Radar Chart
Let’s take a look at the characteristics of a standard radar chart:
The basic characteristics of the radar chart are as follows:
- There are three or more axes
- The angle between the shafts and the other shafts are the same
- There should be at least one scale on each axis except the center point
- Each axis has the same number of scales
- The distance between each scale is the same
- The scales between the axes are connected to form a grid line
Let’s Build it
Calculate the axis angle
Calculate the number of angles between the shafts [360 ÷ number of axis], and then calculate the angles of all shafts:
this.angles = [];
//Angle between shafts
const iAngle = 360 / this.axes;
for (let i = 0; i < this.axes; i++) {
    // Calculate
    const angle = iAngle * I;
    this.angles.push(angle);
}
Calculate scale coordinates
The radar chart has at least three axes, and each axis should have one or more scales (not including the center point).
A two-dimensional array is needed to save the coordinates of all scales, starting from the outermost scale (that is, the end of the axis) to record, so that we can read it when drawing:
// Create a two-dimensional array
let scalesSet: cc.Vec2[][] = [];
for (let i = 0; i < number of scales on the axis; i++) {
    // Used to save the scale coordinates on the current layer
    let scales = [];
    // Calculate the position of the scale on the axis
    const length = Axis length - (Axis length / Number of scales on the axis * i);
    for (let j = 0; j < this.angles.length; j++) {
        // Calculate the position of the scale on the axis
        const radian = (Math.PI / 180) * this.angles[j];
        // Calculate the coordinates of the scale relative to the center point (0, 0) according to the trigonometric formula
        const pos = cc.v2(length * Math.cos(radian), length * Math.sin(radian));
        // Advance array
        scales.push(pos);
    }
    // Advance two-dimensional array
    scalesSet.push(scales);
}
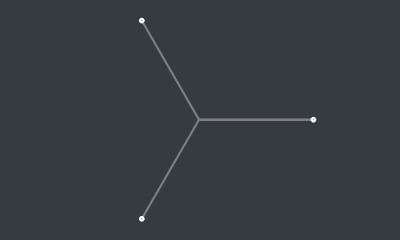
Draw axis and outer grid lines
Axis
Connecting a center point (0, 0) and an outermost layer scalesSet[0] of the scale is the axis:
// Traverse all the outermost scales
for (let i = 0; i < scalesSet[0].length; i++) {
    // Move the pen to the center point
    this.graphics.moveTo(0, 0);
    // Create lines
    this.graphics.lineTo(scalesSet[0][i].x, scalesSet[0][i].y);
}
Outer grid
All axes connecting outermost layer scalesSet[0] of scale that formed on the outer grid lines:
// The pen moves to the first point
this.graphics.moveTo(scalesSet[0][0].x, scalesSet[0][0].y);
for (let i = 1; i < scalesSet[0].length; i++) {
// Create lines
this.graphics.lineTo(scalesSet[0][i].x, scalesSet[0][i].y);
}
// Close the current line (outer grid line)
this.graphics.close();
Fill and draw
Here you need to pay attention to fill the color first and then draw the line, otherwise the axis and grid lines will be behind the chart and can’t be seen:
// Fill the blank area surrounded by lines
this.graphics.fill();
// Draw the created lines (axis and outer grid lines)
this.graphics.stroke();
Example:
 .
.
Draw inner grid lines
When the scale is greater than 1, the inner grid lines need to be drawn, starting from the subscript 1 of the scale coordinate set:
// Draw inner grid lines only when the scale is greater than 1
if (scalesSet.length > 1) {
    // Start from the bottom 1 (subscript 0 is the outer grid line)
    for (let i = 1; i < scalesSet.length; i++) {
        // The pen moves to the first point
        this.graphics.moveTo(scalesSet[i][0].x, scalesSet[i][0].y);
        for (let j = 1; j < scalesSet[i].length; j++) {
            // Create lines
            this.graphics.lineTo(scalesSet[i][j].x, scalesSet[i][j].y);
        }
        // Close the current line (inner grid line)
        this.graphics.close();
    }
    // Draw the created line (inner grid line)
    this.graphics.stroke();
}
The foundation of the radar chart is drawn:

Stroke
Before cosing the line drawing logic, first, determine the data structure that is need:
- Numerical array - required, the ratio in decimal form, containing at least three values.
- Line width - optional, use the default value if not specified.
- Line color - optional, use the default value if not specified.
- Fill color - optional, use the default value if not specified.
- The color of the node - optional, use the default value if not specified.
The specific data structure is as follows (the export type is convenient for external use):
/*Radar chart data*/
export interface RadarChartData {

    /* Values */
    values: number[];

    /* Line width */
    lineWidth?: number;

    /* Line color */
    lineColor?: cc.Color;

    /* Fill color */
    fillColor?: cc.Color;

    /* Node color */
    joinColor?: cc.Color;

}
Do it
Plotting the data is relatively simple. Developers only need to figure out the position of the data point in the chart and connect the data.
In the draw function that receives a radar or more map data, and drawn in the order of traversal:
/**
    * Plot data
    * @param data
    */
public draw(data: RadarChartData | RadarChartData[]) {
    // data processing
    const datas = Array.isArray(data) ? data : [data];

    // Start plotting data
    for (let i = 0; i < datas.length; i++) {
        // Load colors
        this.graphics.strokeColor = datas[i].lineColor || defaultOptions.lineColor;
        this.graphics.fillColor = datas[i].fillColor || defaultOptions.fillColor;
        this.graphics.lineWidth = datas[i].lineWidth || defaultOptions.lineWidth;

        // Calculate node coordinates
        let coords = [];
        for (let j = 0; j < this.axes; j++) {
            const value = datas[i].values[j] > 1 ? 1 : datas[i].values[j];
            const length = value * this.axisLength;
            const radian = (Math.PI / 180) * this.angles[j];
            const pos = cc.v2(length * Math.cos(radian), length * Math.sin(radian))
            coords.push(pos);
        }

        // Create lines
        this.graphics.moveTo(coords[0].x, coords[0].y);
        for (let j = 1; j < coords.length; j++) {
            this.graphics.lineTo(coords[j].x, coords[j].y);
        }
        this.graphics.close(); // 闭合线条

        // close lines
        this.graphics.fill();
        // Draw lines
        this.graphics.stroke();

        // Draw data node
        for (let j = 0; j < coords.length; j++) {
            // Big circle
            this.graphics.strokeColor = datas[i].lineColor || defaultOptions.lineColor;
            this.graphics.circle(coords[j].x, coords[j].y, 2);
            this.graphics.stroke();
            // Little circle
            this.graphics.strokeColor = datas[i].joinColor || defaultOptions.joinColor;
            this.graphics.circle(coords[j].x, coords[j].y, .65);
            this.graphics.stroke();
        }

    }
}
A successfully produced and usable radar chart:
Can we make it move?
- The completely static radar chart is too dull and ordinary, you have to find a way to make it move!
- The values of our radar chart data are in the form of arrays. Have you thought of how to make these values move?
Thanks to the Tween easing system provided by Cocos Creator, it makes complex data very easy to move!
Only cc.tween is needed to support the ease of any property of any object.
For more information, please refer to the Easing System documentation.
Another idea
The idea is:
- Save the current data to the current instance
this.curDatasof - Upon receipt of the new data, the use
cc.tweenofthis.curDatatheattribute easing - In the
update()call draw function, redrawn every framethis.curDatasdata
Updating every frame
// Current radar chart data
private curDatas: RadarChartData[] = [];

protected update() {
    if (!this.keepUpdating) return;
    // plot current data
    this.draw(this.curDatas);
}
Easing data
/**
    * Easing drawing
    * @param data target data
    * @param duration Animation duration
    */
public to(data: RadarChartData | RadarChartData[], duration: number) {
    // Handling repeated calls
    this.unscheduleAllCallbacks();

    // Packing the list data
    const datas = Array.isArray(data) ? data : [data];

    // Open every frame update
    this.keepUpdating = true;

    // Let’s write!
    for (let i = 0; i < datas.length; i++) {
        // The value moves!
        // Traverse all the values in the data and make them move one by one!
        for (let j = 0; j < this.curDatas[i].values.length; j++) {
            // Limit the maximum value to 1 (that is, 100%)
            const value = datas[i].values[j] > 1 ? 1 : datas[i].values[j];
            cc.tween(this.curDatas[i].values)
                .to(duration, { [j]: value })
                .start();
        }
        // The style changes!
        // If not specified, use the original style!
        cc.tween(this.curDatas[i])
            .to(duration, {
                lineWidth: datas[i].lineWidth || this.curDatas[i].lineWidth,
                lineColor: datas[i].lineColor || this.curDatas[i].lineColor,
                fillColor: datas[i].fillColor || this.curDatas[i].fillColor,
                joinColor: datas[i].joinColor || this.curDatas[i].joinColor
            })
            .start();
    }

    this.scheduleOnce(() => {
        // Turn off every frame update
        this.keepUpdating = false;
    }, duration);
}
